

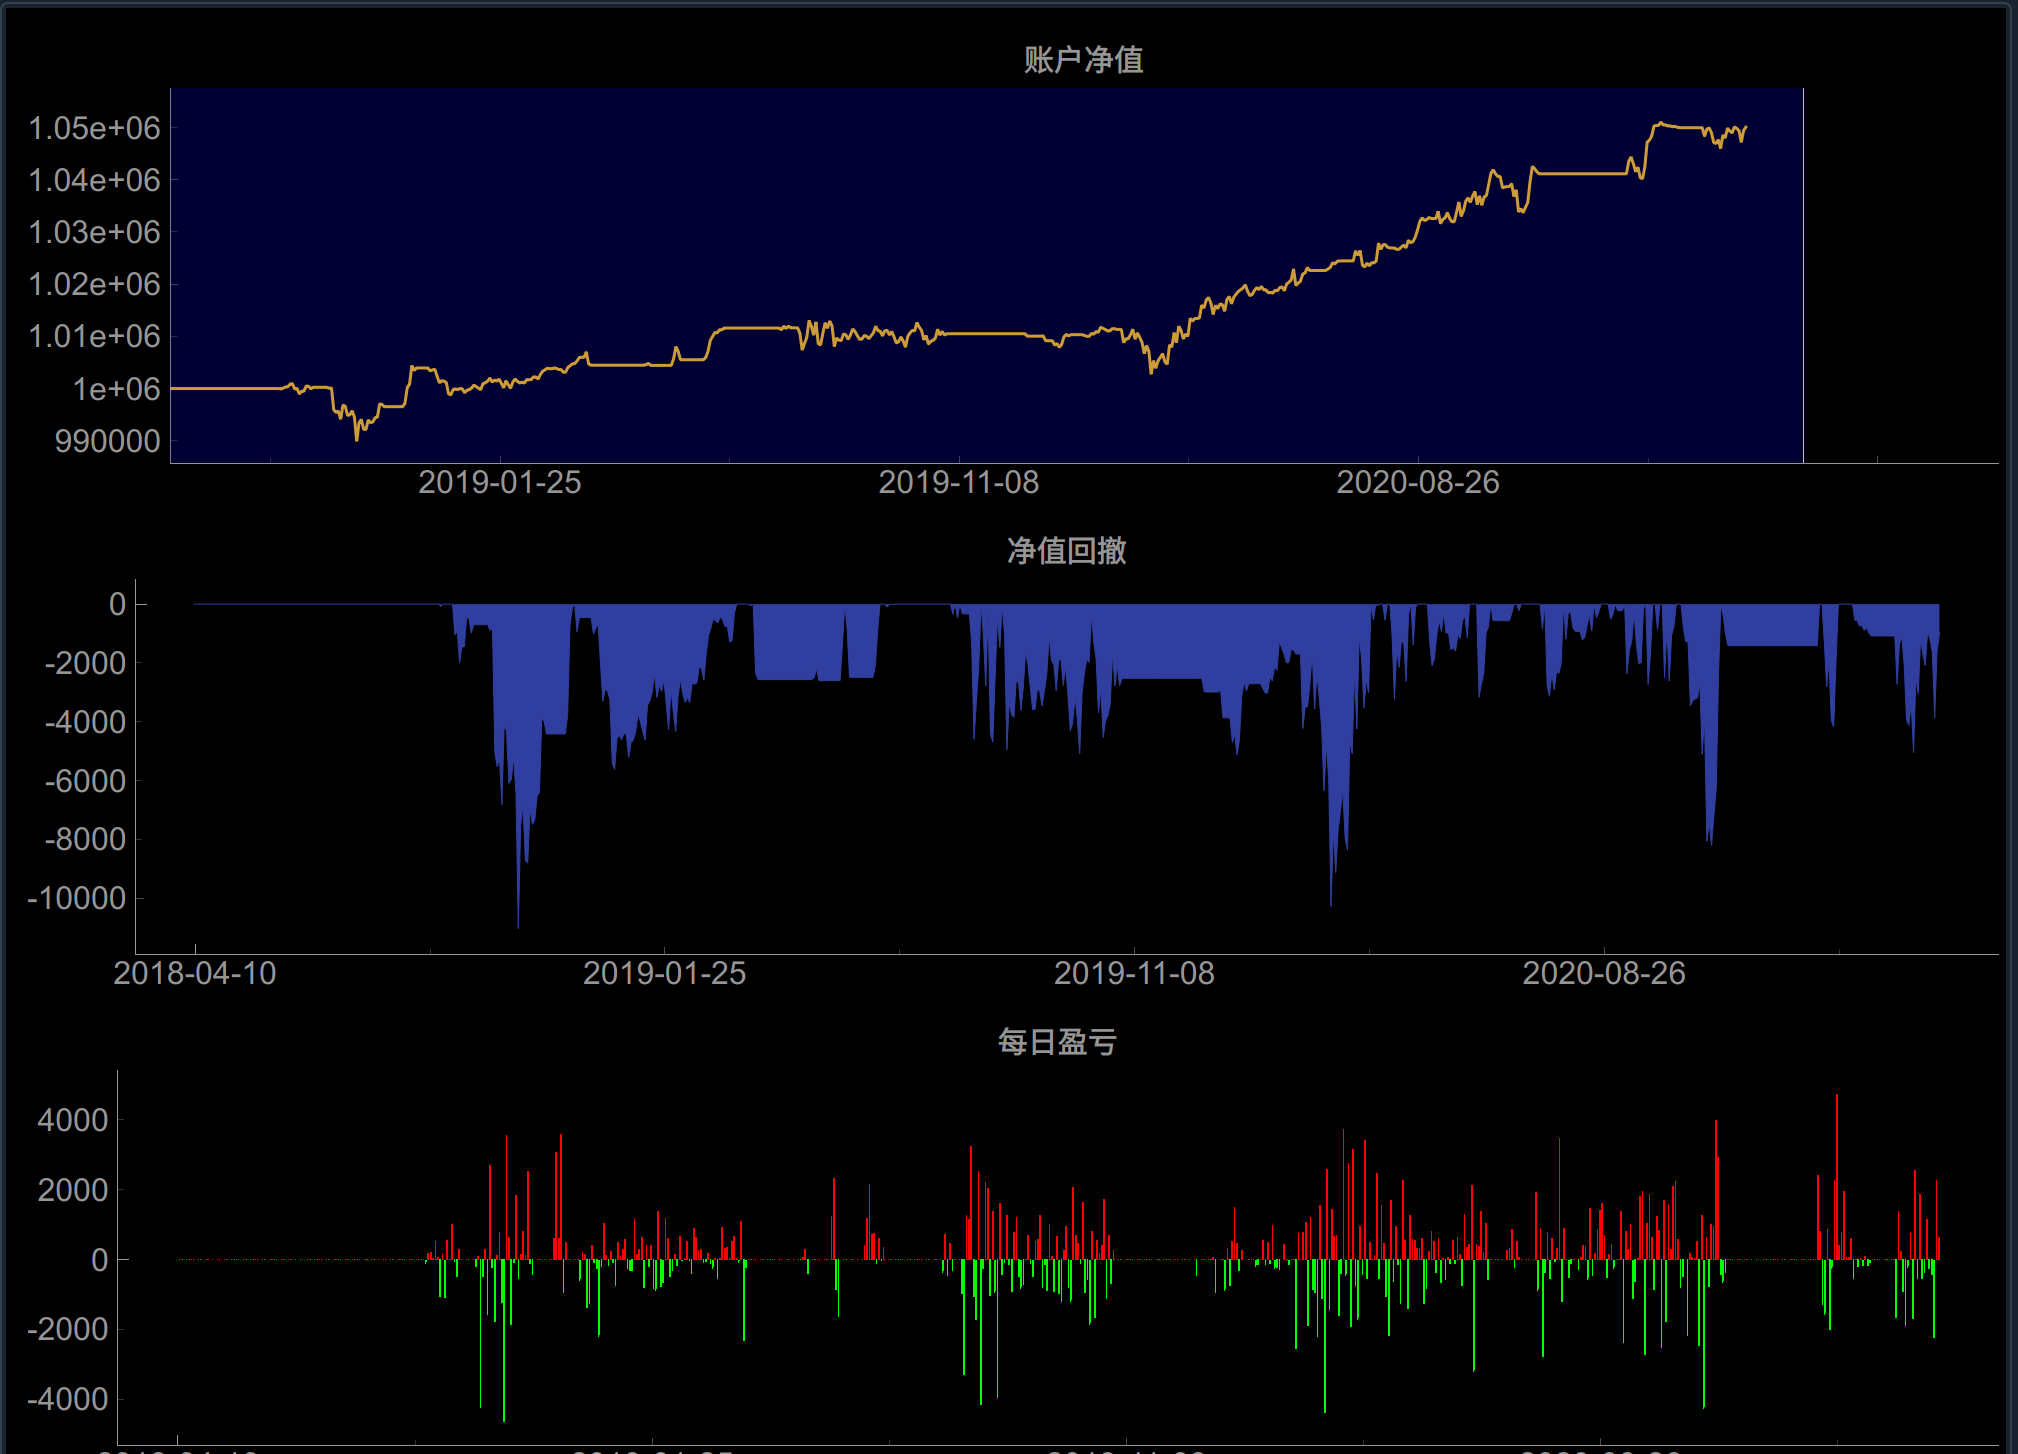
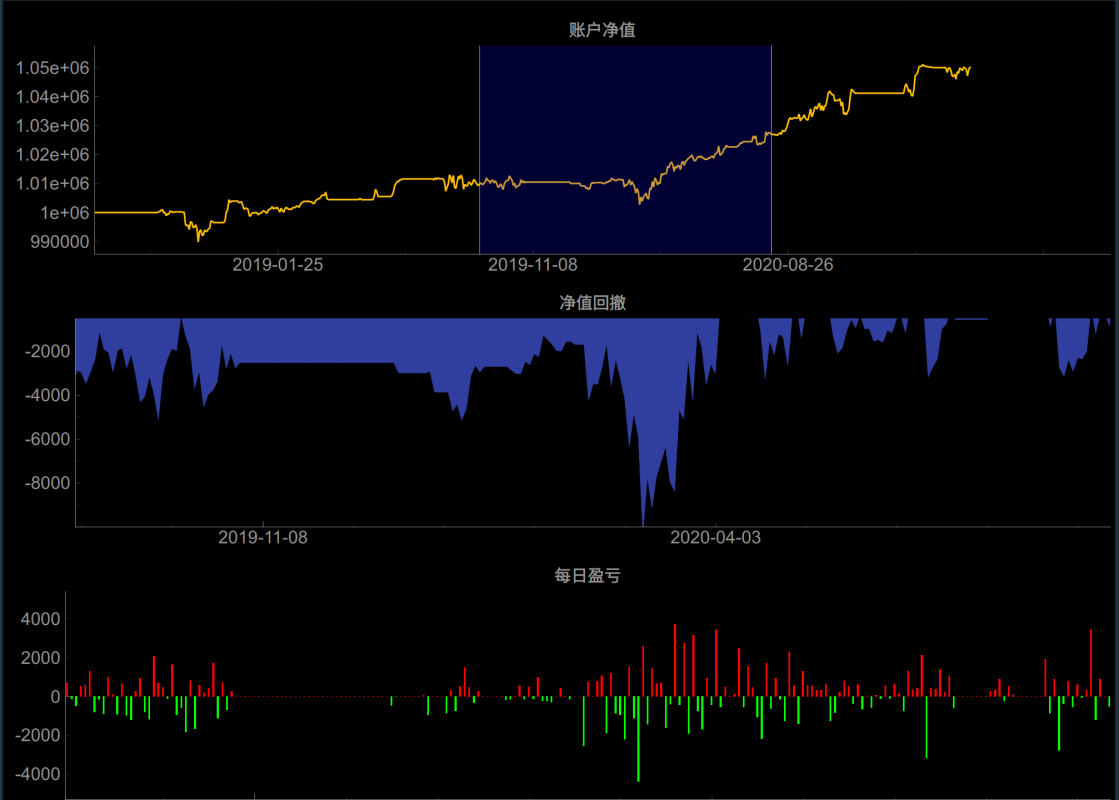
如题,为了方便CTA回测显示,效果如下:
涉及代码修改:
vnpy/app/cta_strategy/ui/widget.py
将原文件中的BacktesterChart类用以下代码替代即可
class BacktesterChart(pg.GraphicsWindow):
""""""
def __init__(self):
    """"""
    super().__init__(title="Backtester Chart")

    self.dates = {}

    self.init_ui()

def init_ui(self):
    """"""
    pg.setConfigOptions(antialias=True)

    # Create plot widgets
    self.balance_plot = self.addPlot(
        title="账户净值",
        axisItems={"bottom": DateAxis(self.dates, orientation="bottom")}
    )
    self.region_size = [0,100]
    self.nextRow()

    self.drawdown_plot = self.addPlot(
        title="净值回撤",
        axisItems={"bottom": DateAxis(self.dates, orientation="bottom")}
    )

    self.nextRow()

    self.pnl_plot = self.addPlot(
        title="每日盈亏",
        axisItems={"bottom": DateAxis(self.dates, orientation="bottom")}
    )
    self.nextRow()

    self.distribution_plot = self.addPlot(title="盈亏分布")

    # Add curves and bars on plot widgets
    self.balance_curve = self.balance_plot.plot(
        pen=pg.mkPen("#ffc107", width=3)
    )

    dd_color = "#303f9f"
    self.drawdown_curve = self.drawdown_plot.plot(
        fillLevel=-0.3, brush=dd_color, pen=dd_color
    )

    profit_color = 'r'
    loss_color = 'g'
    self.profit_pnl_bar = pg.BarGraphItem(
        x=[], height=[], width=0.3, brush=profit_color, pen=profit_color
    )
    self.loss_pnl_bar = pg.BarGraphItem(
        x=[], height=[], width=0.3, brush=loss_color, pen=loss_color
    )
    self.pnl_plot.addItem(self.profit_pnl_bar)
    self.pnl_plot.addItem(self.loss_pnl_bar)

    distribution_color = "#6d4c41"
    self.distribution_curve = self.distribution_plot.plot(
        fillLevel=-0.3, brush=distribution_color, pen=distribution_color
    )

def clear_data(self):
    """"""
    self.balance_plot.replot()
    self.drawdown_plot.replot()
    self.pnl_plot.replot()
    self.balance_curve.setData([], [])
    self.drawdown_curve.setData([], [])
    self.profit_pnl_bar.setOpts(x=[], height=[])
    self.loss_pnl_bar.setOpts(x=[], height=[])
    self.distribution_curve.setData([], [])

def set_data(self, df):
    """"""
    if df is None:
        return

    count = len(df)

    self.dates.clear()
    for n, date in enumerate(df.index):
        self.dates[n] = date

    self.region_size = [df.shape[0]-99, df.shape[0]-1]
    # 设置交叉显示
    self.region = pg.LinearRegionItem(self.region_size)  # 创建区域,可用于同步显示另一个图像
    self.region.setZValue(1)
    self.balance_plot.addItem(self.region, ignoreBounds=True)
    self.region.sigRegionChanged.connect(self.drawdown_plot_update)
    self.region.sigRegionChanged.connect(self.pnl_plot_update)

    self.drawdown_plot.sigXRangeChanged.connect(self.updateRegion_by_drawdown_plot)
    self.pnl_plot.sigXRangeChanged.connect(self.updateRegion_by_pnl_plot)

    # Set data for curve of balance and drawdown
    self.balance_curve.setData(df["balance"])
    self.drawdown_curve.setData(df["drawdown"])

    # Set data for daily pnl bar
    profit_pnl_x = []
    profit_pnl_height = []
    loss_pnl_x = []
    loss_pnl_height = []

    for count, pnl in enumerate(df["net_pnl"]):
        if pnl >= 0:
            profit_pnl_height.append(pnl)
            profit_pnl_x.append(count)
        else:
            loss_pnl_height.append(pnl)
            loss_pnl_x.append(count)

    self.profit_pnl_bar.setOpts(x=profit_pnl_x, height=profit_pnl_height)
    self.loss_pnl_bar.setOpts(x=loss_pnl_x, height=loss_pnl_height)

    # Set data for pnl distribution
    hist, x = np.histogram(df["net_pnl"], bins="auto")
    x = x[:-1]
    self.distribution_curve.setData(x, hist)

def drawdown_plot_update(self):
    self.region.setZValue(1)
    minX, maxX = self.region.getRegion()
    self.drawdown_plot.setXRange(minX, maxX, padding=0)

def pnl_plot_update(self):
    self.region.setZValue(1)
    minX, maxX = self.region.getRegion()
    self.pnl_plot.setXRange(minX, maxX, padding=0)

def updateRegion_by_drawdown_plot(self):
    self.region.setRegion(self.drawdown_plot.getViewBox().viewRange()[0])

def updateRegion_by_pnl_plot(self):
    self.region.setRegion(self.pnl_plot.getViewBox().viewRange()[0])