

dukascopy_k_line_chart_frontend
A Powerfull K-Line chart from Dukascopy
Github: https://github.com/nicolz/dukascopy_k_line_chart_frontend
分享我刚刚扒的K线组件
来源: https://www.dukascopy.com/swiss/chinese/marketwatch/charts/
Demo:
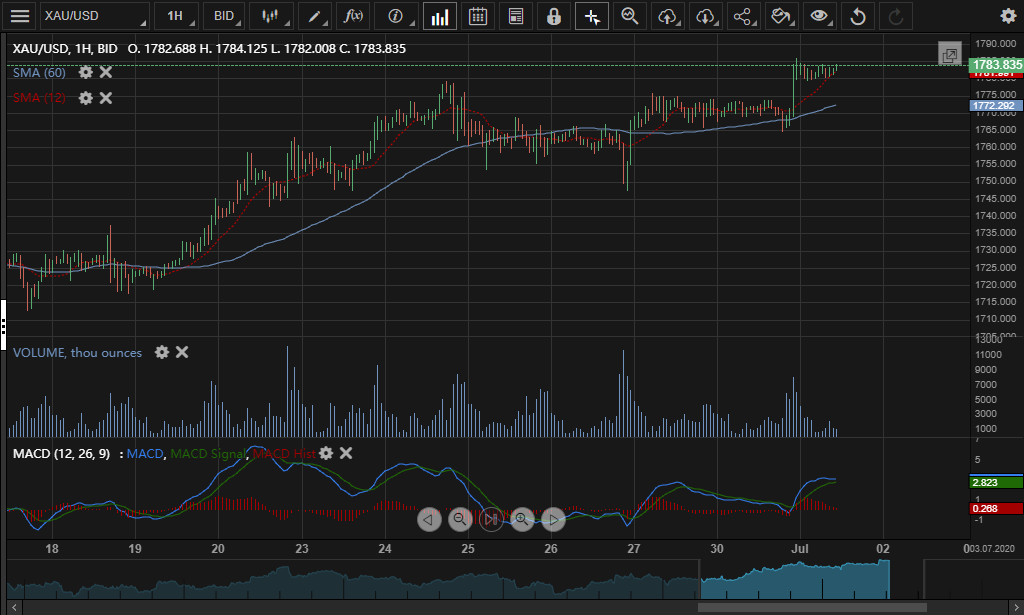
UI
如图:
特点:
支持多品种 :外汇、贵金属、全球指数、股票、ETF等
自带几十种指标
支持画图
支持导出导入
支持多种主题
支持实时新闻
支持在图表上显示财经日历
等等...
使用:
注意:中国用户需要翻越GWF
var ui = new dc.ChartUI(window.location.search.replace(/^\?/, ''));
        // ui.setTime(1593479298000);
        // ui.setAuthType(dc.chartui.AuthType.OWNFXCOMM);
        // ui.setFxcommOptions({
        //  fxcommCountriesUri: 'https://freeserv.dukascopy.com/2.0/index.php?path=common/countries',
        //  fxcommUri: 'https://fxcomm-auth.dukascopy.com/',
        //  fxcommReturnUri: 'https://freeserv.dukascopy.com/2.0/',
        //  fxcommSocialReturnUri: 'https://freeserv.dukascopy.com/2.0/index.php?path=fxcomm/social',
        //  fxcommTermsUri: 'https://www.dukascopy.com/fxcomm/register/?action=print-terms',
        //  fxcommDownloadTermsUri: 'https://www.dukascopy.com/fxcomm/register/?action=download-terms'
        // });
        ui.showLogo(false);
        // ui.disclaimerURI('https://freeserv.dukascopy.com/2.0/index.php?path=common/disclaimer');
        // ui.watermarkImage('static/watermark.png');
        // ui.chartUri('https://freeserv.dukascopy.com/2.0/index.php?path=chart/popup');
        // ui.setWorkspaceChartURI('//freeserv.dukascopy.com/2.0/');
        // ui.setSocialSharingChartURI('https://freeserv.dukascopy.com/2.0/');
        ui.showContextMenu(true);
        ui.showNewsButton(true);
        ui.showObjectPane(true);
        // ui.chartSettingsDialog(true);
        // ui.allowChartWorkspaceImport(true);
        // ui.allowChartWorkspaceExport(true);
        // ui.allowSocialSharing(true);
        // ui.showPanDialog(true);
        // ui.showIndicatorsDialog(true);
        // ui.showTabs(true);
        ui.instrumentUri('https://freeserv.dukascopy.com/2.0/index.php?path=common/instruments');
        ui.downloadifyImage('static/downloadify.png');
        ui.downloadifySWF('static/downloadify.swf');
        ui.appendChartOptions({
            liveEmulation: true,
            eet: true,
            transportType: dc.TransportType.FREESERV,
            dataServerURI: 'https://freeserv.dukascopy.com/2.0/index.php?path=chart/json3',
            disclaimerURI: 'https://freeserv.dukascopy.com/2.0/?path=common/disclaimer',
            newsServerURI: 'https://freeserv.dukascopy.com/2.0/index.php?path=economic_calendar/getNewsForInstrument',
            timezonesUri: 'https://freeserv.dukascopy.com/2.0/index.php?path=common/timezones&timezone=America/New_York',
            usStocksDelay: true
        });
        ui.setLanguage('zh');
        // ui.setFxspiderUri('https://www.dukascopy.com/fxspider');
        // ui.setFxspiderToken('asGFt457kgHqqqg68vdgjJHFtDG6lghy7cdHHfqh');
        ui.render();

        var chart = ui.getChart();
        //chart.setDataCache(new dc.CompressedDataCache());
        chart.setTimeLineScroller(true);
        chart.init();
};
注意注释部分,通过设置参数,你可以对图表组件进行自定义
同时也支持URL传参, 例如:
改造
使用自己的数据源(当然也可以配合VNPY使用):
你只需要自己实现这个行情接口:
dataServerURI: 'https://freeserv.dukascopy.com/2.0/index.php?path=chart/json3',
提供数据源格式如下即可:
var hdfData = [[1592784000000,1749.015,1750.915,1747.2279999999998,1748.2179999999998,2144289.9963999996,null],[1592787600000,1748.268,1758.598,1746.1979999999999,1758.128,3882405.0181999994,null],[1592791200000,1758.128,1758.328,1750.365,1751.278,2584650.0026999996,null],[1592794800000,1751.265,1754.038,1749.115,1752.318,2125479.997000001,null],[1592798400000,1752.318,1752.658,1750.408,1752.348,1385869.9985000002,null],[1592802000000,1752.348,1753.528,1750.925,1752.5079999999998,1563689.9981000004,null],[1592805600000,1752.608,1753.2179999999998,1750.165,1751.158,2669010.0002999986,null]
// [时间戳,开盘价,最高价,最低价,收盘价,交易量, null]
以上,改造非常简单,不需要关心chartui.js底层实现
最后声明,仅供个人学习交流使用,请勿商用,法律后果自付
剩下的留给大伙折腾
Enjoy!
