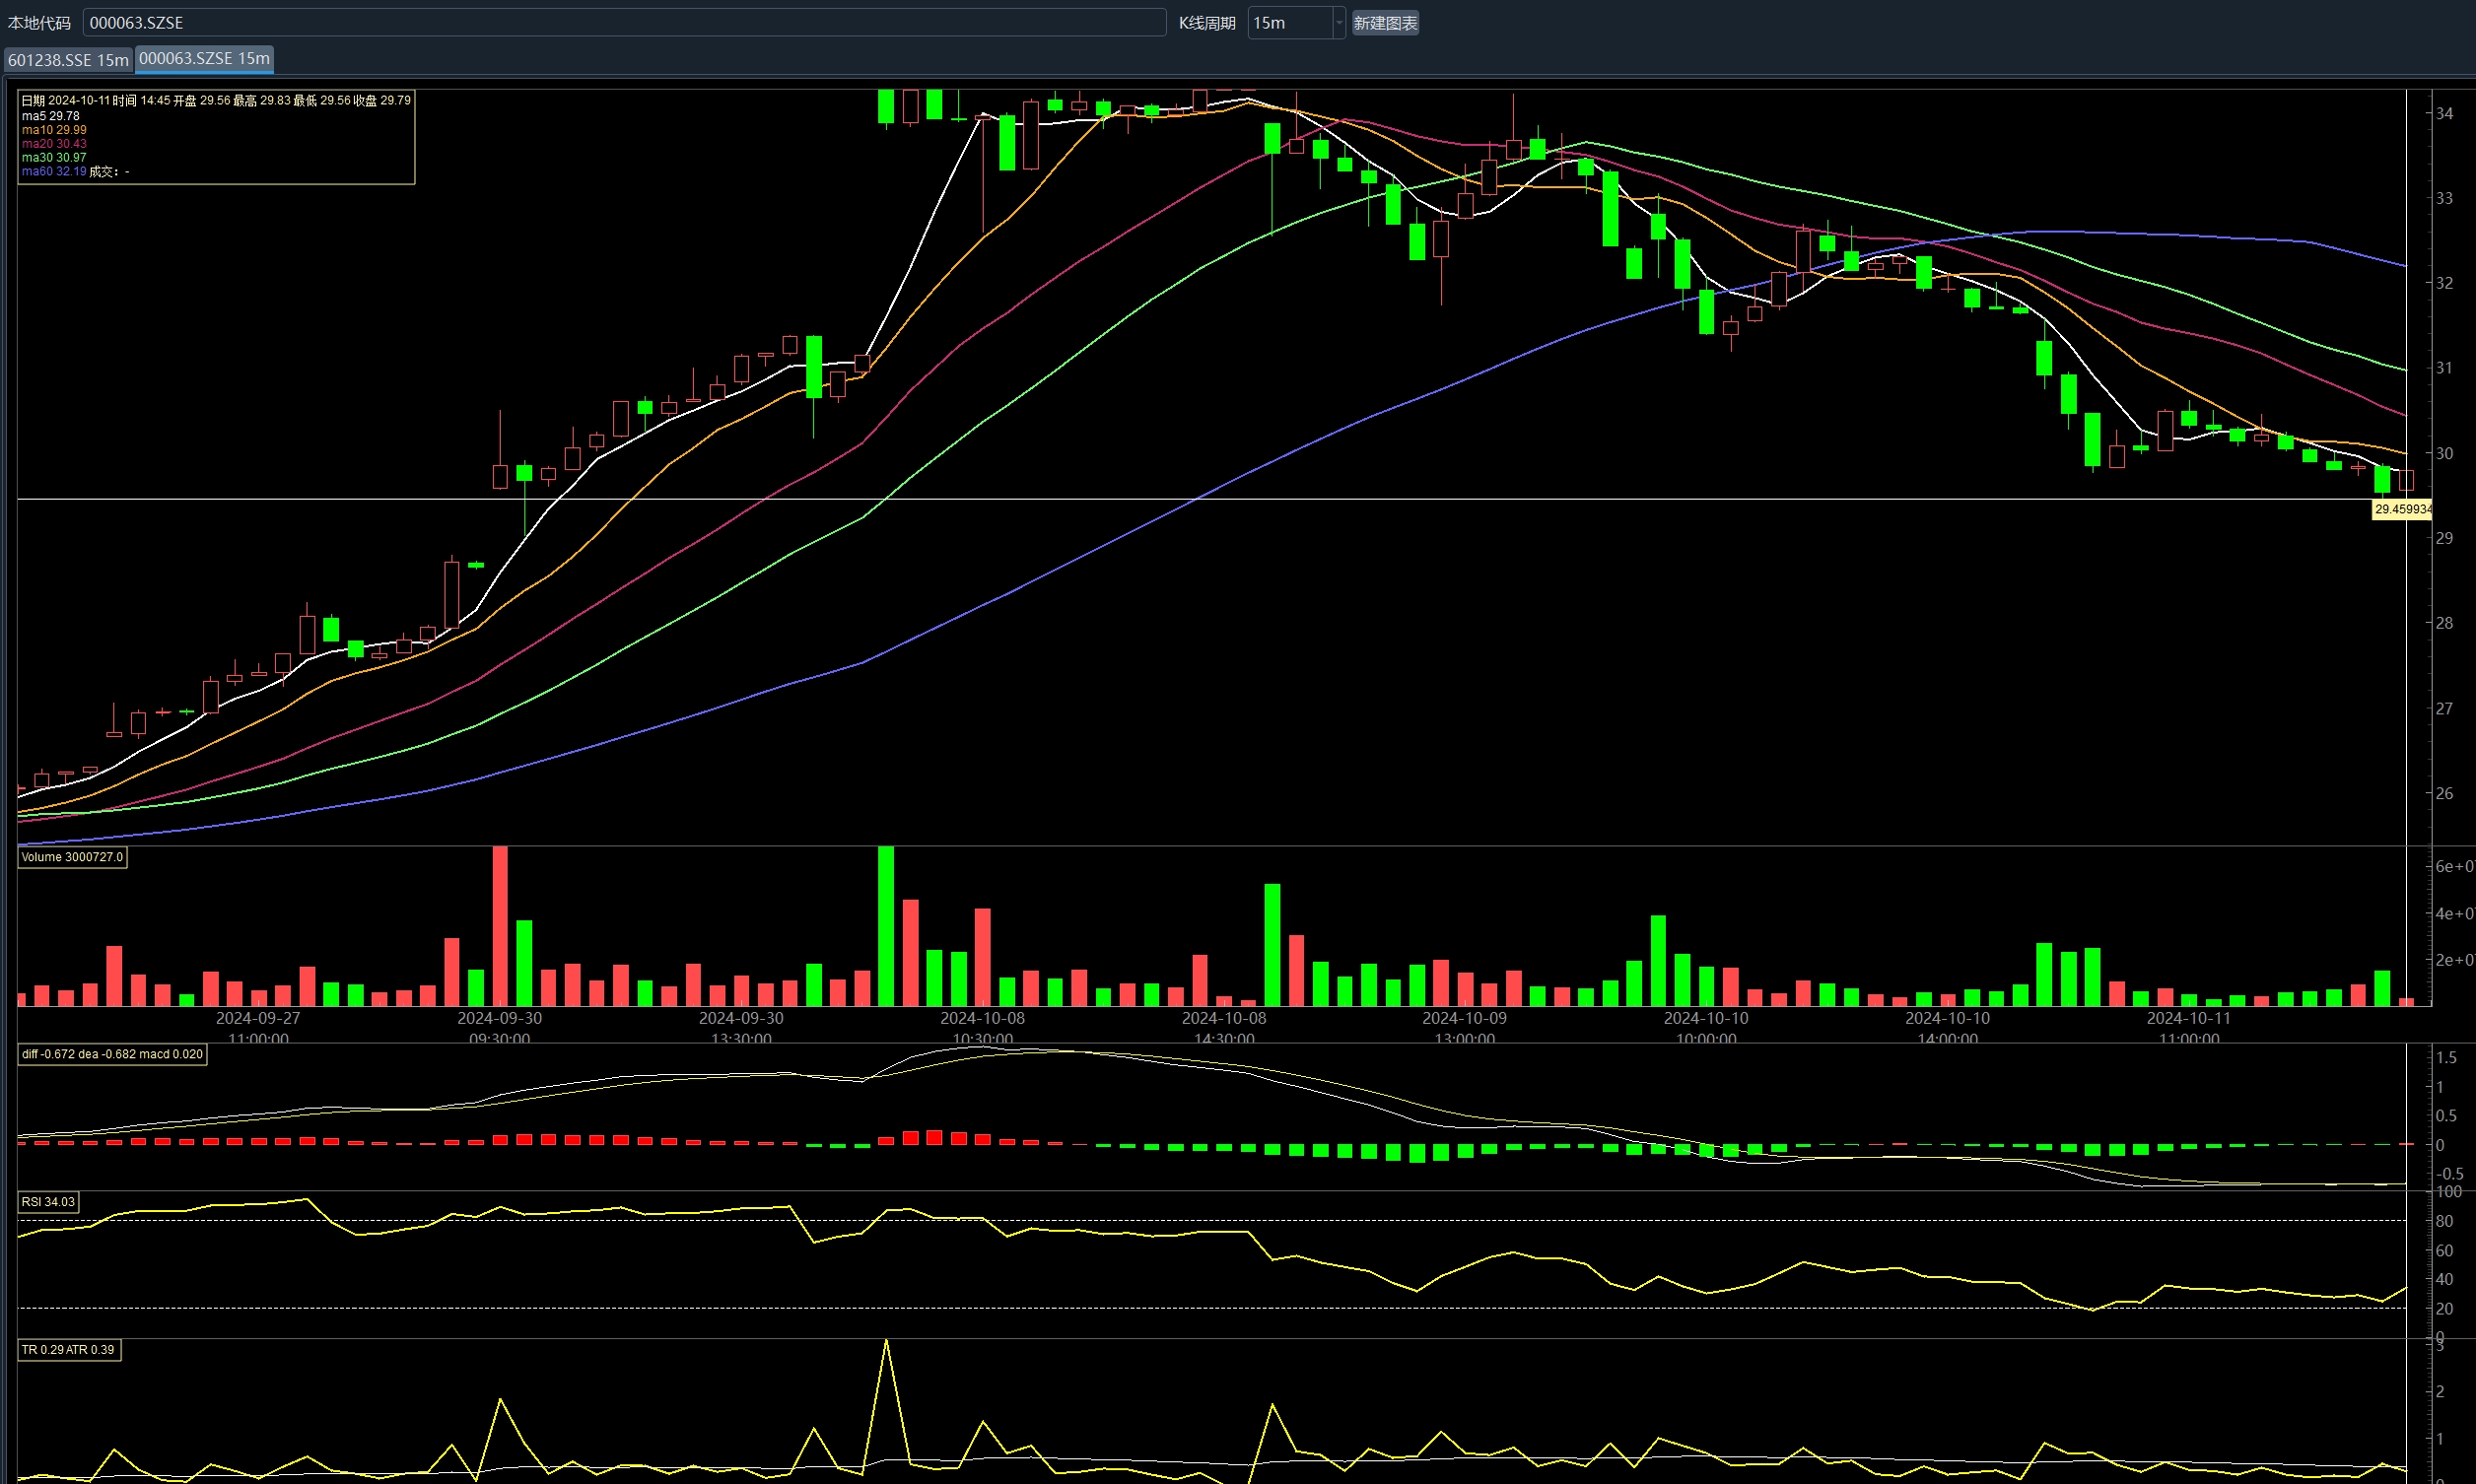
因为vnpy的实时k线图表是根据时间来生成K线的,所以只能合成1分钟图,鉴于实际使用中需要合成不同的K线图,参考了论坛的大V的方案,但大V改动的有点多,个人又太懒,不想改动原来官方太多,因此个人也做了一个方案。想到了以前都是看大家分享的代码进步了,因此我也尝试分享一下
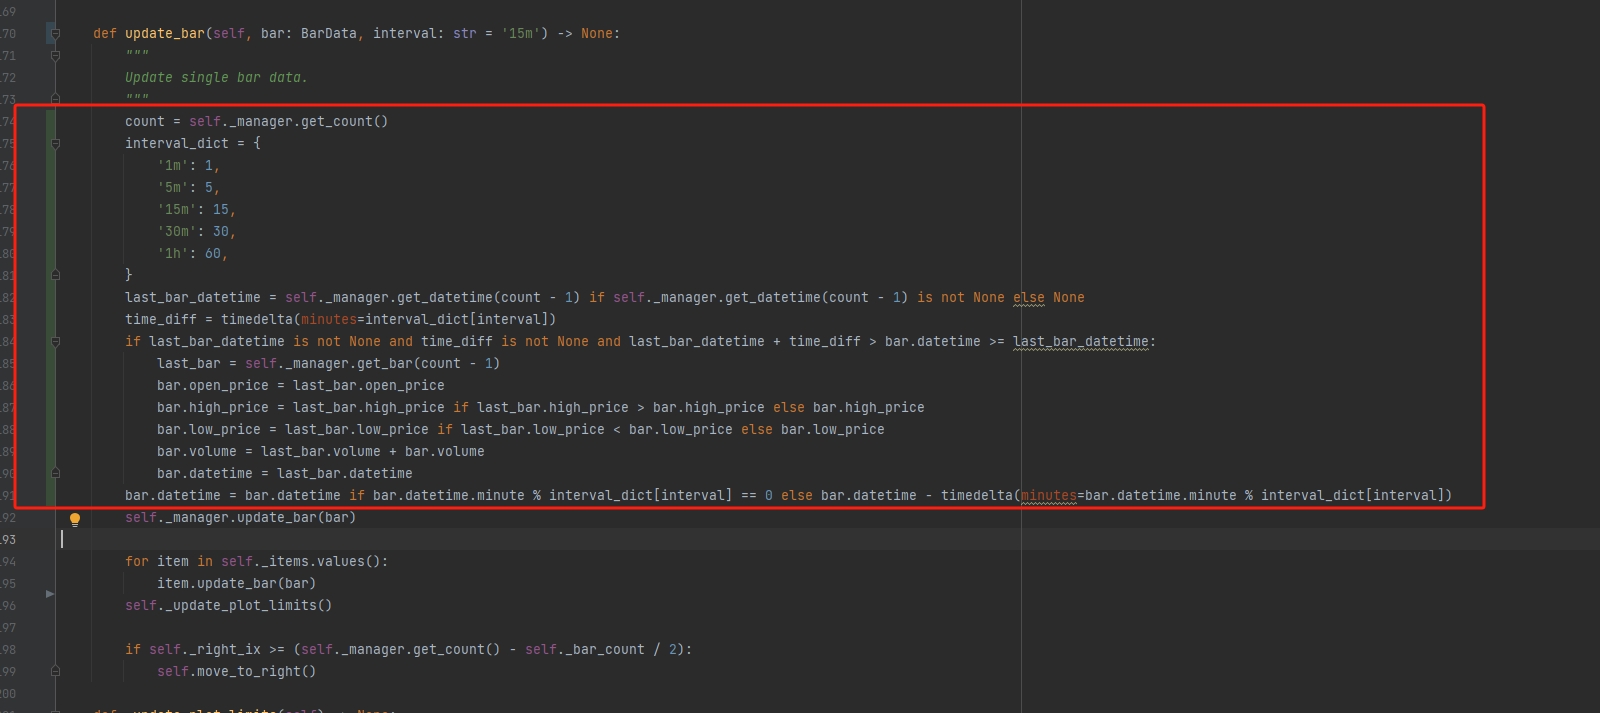
只需要在vnpy包-chart包的widget.py文件的update_bar方法添加即可
    def update_bar(self, bar: BarData, interval: str = '15m') -> None:
        """
        Update single bar data.
        """
        count = self._manager.get_count()
        interval_dict = {
            '1m': 1,
            '5m': 5,
            '15m': 15,
            '30m': 30,
            '1h': 60,
        }
        last_bar_datetime = self._manager.get_datetime(count - 1) if self._manager.get_datetime(count - 1) is not None else None
        time_diff = timedelta(minutes=interval_dict[interval])
        if last_bar_datetime is not None and time_diff is not None and last_bar_datetime + time_diff > bar.datetime >= last_bar_datetime:
            last_bar = self._manager.get_bar(count - 1)
            bar.open_price = last_bar.open_price
            bar.high_price = last_bar.high_price if last_bar.high_price > bar.high_price else bar.high_price
            bar.low_price = last_bar.low_price if last_bar.low_price < bar.low_price else bar.low_price
            bar.volume = last_bar.volume + bar.volume
            bar.datetime = last_bar.datetime
        bar.datetime = bar.datetime if bar.datetime.minute % interval_dict[interval] == 0 else bar.datetime - timedelta(minutes=bar.datetime.minute % interval_dict[interval])
        self._manager.update_bar(bar)

        for item in self._items.values():
            item.update_bar(bar)
        self._update_plot_limits()

        if self._right_ix >= (self._manager.get_count() - self._bar_count / 2):
            self.move_to_right()
目前支持1、5、10、15、30、60分钟图