

1. 为什么要隐藏与显示K线图表的信息板?
K线图表中主图与副图都有信息板,当我们用选择某个K线时,它用文字的形式表达每个K线修改的信息以及指标数值,它很有用。但是有时因为主图或者副图的指标过多,抑或是显示的信息过多,它会覆盖主图或副图的左上角或者右上角开始的很大一片区域,很影响我们的观看效果,尤其是遇到下跌行情时,K线从主图的左上角开始,到主图的右下角结束,那么这个时候你无论如何也看不到左上角的K线,因为它们被信息板遮住了。怎么办?隐藏信息板是个好办法。
2. 实现方法
修改vnpy\chart\widget.py中的class ChartCursor,代码如下:
class ChartCursor(QtCore.QObject):
    """"""

    def __init__(
        self,
        widget: ChartWidget,
        manager: BarManager,
        plots: Dict[str, pg.GraphicsObject],
        item_plot_map: Dict[ChartItem, pg.GraphicsObject]
    ) -> None:
        """"""
        super().__init__()

        self._widget: ChartWidget = widget
        self._manager: BarManager = manager
        self._plots: Dict[str, pg.GraphicsObject] = plots
        self._item_plot_map: Dict[ChartItem, pg.GraphicsObject] = item_plot_map

        self._x: int = 0
        self._y: int = 0
        self._plot_name: str = ""

        self._info_visibles:dict[str,bool] = {} # hxxjava add 2023-2-10

        self._init_ui()
        self._connect_signal()

    def _init_ui(self) -> None:
        """"""
        self._init_line()
        self._init_label()
        self._init_info()

    def _init_line(self) -> None:
        """
        Create line objects.
        """
        self._v_lines: Dict[str, pg.InfiniteLine] = {}
        self._h_lines: Dict[str, pg.InfiniteLine] = {}
        self._views: Dict[str, pg.ViewBox] = {}

        pen: QtGui.QPen = pg.mkPen(WHITE_COLOR)

        for plot_name, plot in self._plots.items():
            v_line: pg.InfiniteLine = pg.InfiniteLine(angle=90, movable=False, pen=pen)
            h_line: pg.InfiniteLine = pg.InfiniteLine(angle=0, movable=False, pen=pen)
            view: pg.ViewBox = plot.getViewBox()

            for line in [v_line, h_line]:
                line.setZValue(0)
                line.hide()
                view.addItem(line)

            self._v_lines[plot_name] = v_line
            self._h_lines[plot_name] = h_line
            self._views[plot_name] = view

    def _init_label(self) -> None:
        """
        Create label objects on axis.
        """
        self._y_labels: Dict[str, pg.TextItem] = {}
        for plot_name, plot in self._plots.items():
            label: pg.TextItem = pg.TextItem(
                plot_name, fill=CURSOR_COLOR, color=BLACK_COLOR)
            label.hide()
            label.setZValue(2)
            label.setFont(NORMAL_FONT)
            plot.addItem(label, ignoreBounds=True)
            self._y_labels[plot_name] = label

        self._x_label: pg.TextItem = pg.TextItem(
            "datetime", fill=CURSOR_COLOR, color=BLACK_COLOR)
        self._x_label.hide()
        self._x_label.setZValue(2)
        self._x_label.setFont(NORMAL_FONT)
        plot.addItem(self._x_label, ignoreBounds=True)

    def _init_info(self) -> None:
        """
        """
        self._infos: Dict[str, pg.TextItem] = {}
        for plot_name, plot in self._plots.items():
            info: pg.TextItem = pg.TextItem(
                "info",
                color=CURSOR_COLOR,
                border=CURSOR_COLOR,
                fill=BLACK_COLOR
            )
            info.hide()
            info.setZValue(2)
            info.setFont(NORMAL_FONT)
            plot.addItem(info)  # , ignoreBounds=True)
            self._infos[plot_name] = info

    def _connect_signal(self) -> None:
        """
        Connect mouse move signal to update function.
        """
        self._widget.scene().sigMouseMoved.connect(self._mouse_moved)
        self._widget.scene().sigMouseClicked.connect(self._mouse_clicked) # hxxjava add 2023-2-10

    def isInfoVisible(self,plot_name:str):
        """ 获取信息板的隐显 hxxjava add 2023-2-10 """
        if plot_name not in self._info_visibles:
            self._info_visibles[plot_name] = True
        return self._info_visibles[plot_name]

    def setInfoVisible(self,plot_name:str,visible:bool):
        """ 设置信息板隐显 hxxjava add 2023-2-10 """
        self._info_visibles[plot_name] = visible

    def _mouse_clicked(self,evt): # hxxjava add 2023-2-10
        """ 用鼠标左键+CTRL键隐显信息板 2023-2-10 """
        button = evt.button()
        modifiers = evt.modifiers()
        if button == QtCore.Qt.LeftButton and modifiers == QtCore.Qt.ControlModifier:
            if self._plot_name in self._infos:
                text_info = self._infos.get(self._plot_name,None)
                old_value = self.isInfoVisible(self._plot_name)
                self.setInfoVisible(self._plot_name,not old_value)
                text_info.setVisible(not old_value)

    def _mouse_moved(self, evt: tuple) -> None:
        """
        Callback function when mouse is moved.
        """
        if not self._manager.get_count():
            return

        # First get current mouse point
        pos: tuple = evt

        for plot_name, view in self._views.items():
            rect = view.sceneBoundingRect()

            if rect.contains(pos):
                mouse_point = view.mapSceneToView(pos)
                self._x = to_int(mouse_point.x())
                self._y = mouse_point.y()
                self._plot_name = plot_name
                break

        # Then update cursor component
        self._update_line()
        self._update_label()
        self.update_info()

    def _update_line(self) -> None:
        """"""
        for v_line in self._v_lines.values():
            v_line.setPos(self._x)
            v_line.show()

        for plot_name, h_line in self._h_lines.items():
            if plot_name == self._plot_name:
                h_line.setPos(self._y)
                h_line.show()
            else:
                h_line.hide()

    def _update_label(self) -> None:
        """"""
        bottom_plot: pg.PlotItem = list(self._plots.values())[-1]
        axis_width = bottom_plot.getAxis("right").width()
        axis_height = bottom_plot.getAxis("bottom").height()
        axis_offset: QtCore.QPointF = QtCore.QPointF(axis_width, axis_height)

        bottom_view: pg.ViewBox = list(self._views.values())[-1]
        bottom_right = bottom_view.mapSceneToView(
            bottom_view.sceneBoundingRect().bottomRight() - axis_offset
        )

        for plot_name, label in self._y_labels.items():
            if plot_name == self._plot_name:
                label.setText(str(self._y))
                label.show()
                label.setPos(bottom_right.x(), self._y)
            else:
                label.hide()

        dt: datetime = self._manager.get_datetime(self._x)
        if dt:
            self._x_label.setText(dt.strftime("%Y-%m-%d %H:%M:%S"))
            self._x_label.show()
            self._x_label.setPos(self._x, bottom_right.y())
            self._x_label.setAnchor((0, 0))

    def update_info(self) -> None:
        """"""
        buf: dict = {}

        for item, plot in self._item_plot_map.items():
            item_info_text: str = item.get_info_text(self._x)

            if plot not in buf:
                buf[plot] = item_info_text
            else:
                if item_info_text:
                    buf[plot] += ("\n\n" + item_info_text)

        for plot_name, plot in self._plots.items():
            plot_info_text: str = buf[plot]
            info: pg.TextItem = self._infos[plot_name]
            info.setText(plot_info_text)
            if self.isInfoVisible(plot_name):    # hxxjava add 2023-2-10
                info.show()

            view: pg.ViewBox = self._views[plot_name]
            top_left = view.mapSceneToView(view.sceneBoundingRect().topLeft())
            info.setPos(top_left)

    def move_right(self) -> None:
        """
        Move cursor index to right by 1.
        """
        if self._x == self._manager.get_count() - 1:
            return
        self._x += 1

        self._update_after_move()

    def move_left(self) -> None:
        """
        Move cursor index to left by 1.
        """
        if self._x == 0:
            return
        self._x -= 1

        self._update_after_move()

    def _update_after_move(self) -> None:
        """
        Update cursor after moved by left/right.
        """
        bar: BarData = self._manager.get_bar(self._x)
        self._y = bar.close_price

        self._update_line()
        self._update_label()

    def clear_all(self) -> None:
        """
        Clear all data.
        """
        self._x = 0
        self._y = 0
        self._plot_name = ""

        for line in list(self._v_lines.values()) + list(self._h_lines.values()):
            line.hide()

        for label in list(self._y_labels.values()) + [self._x_label]:
            label.hide()
3. 运行效果
3.1 未隐藏信息板图表
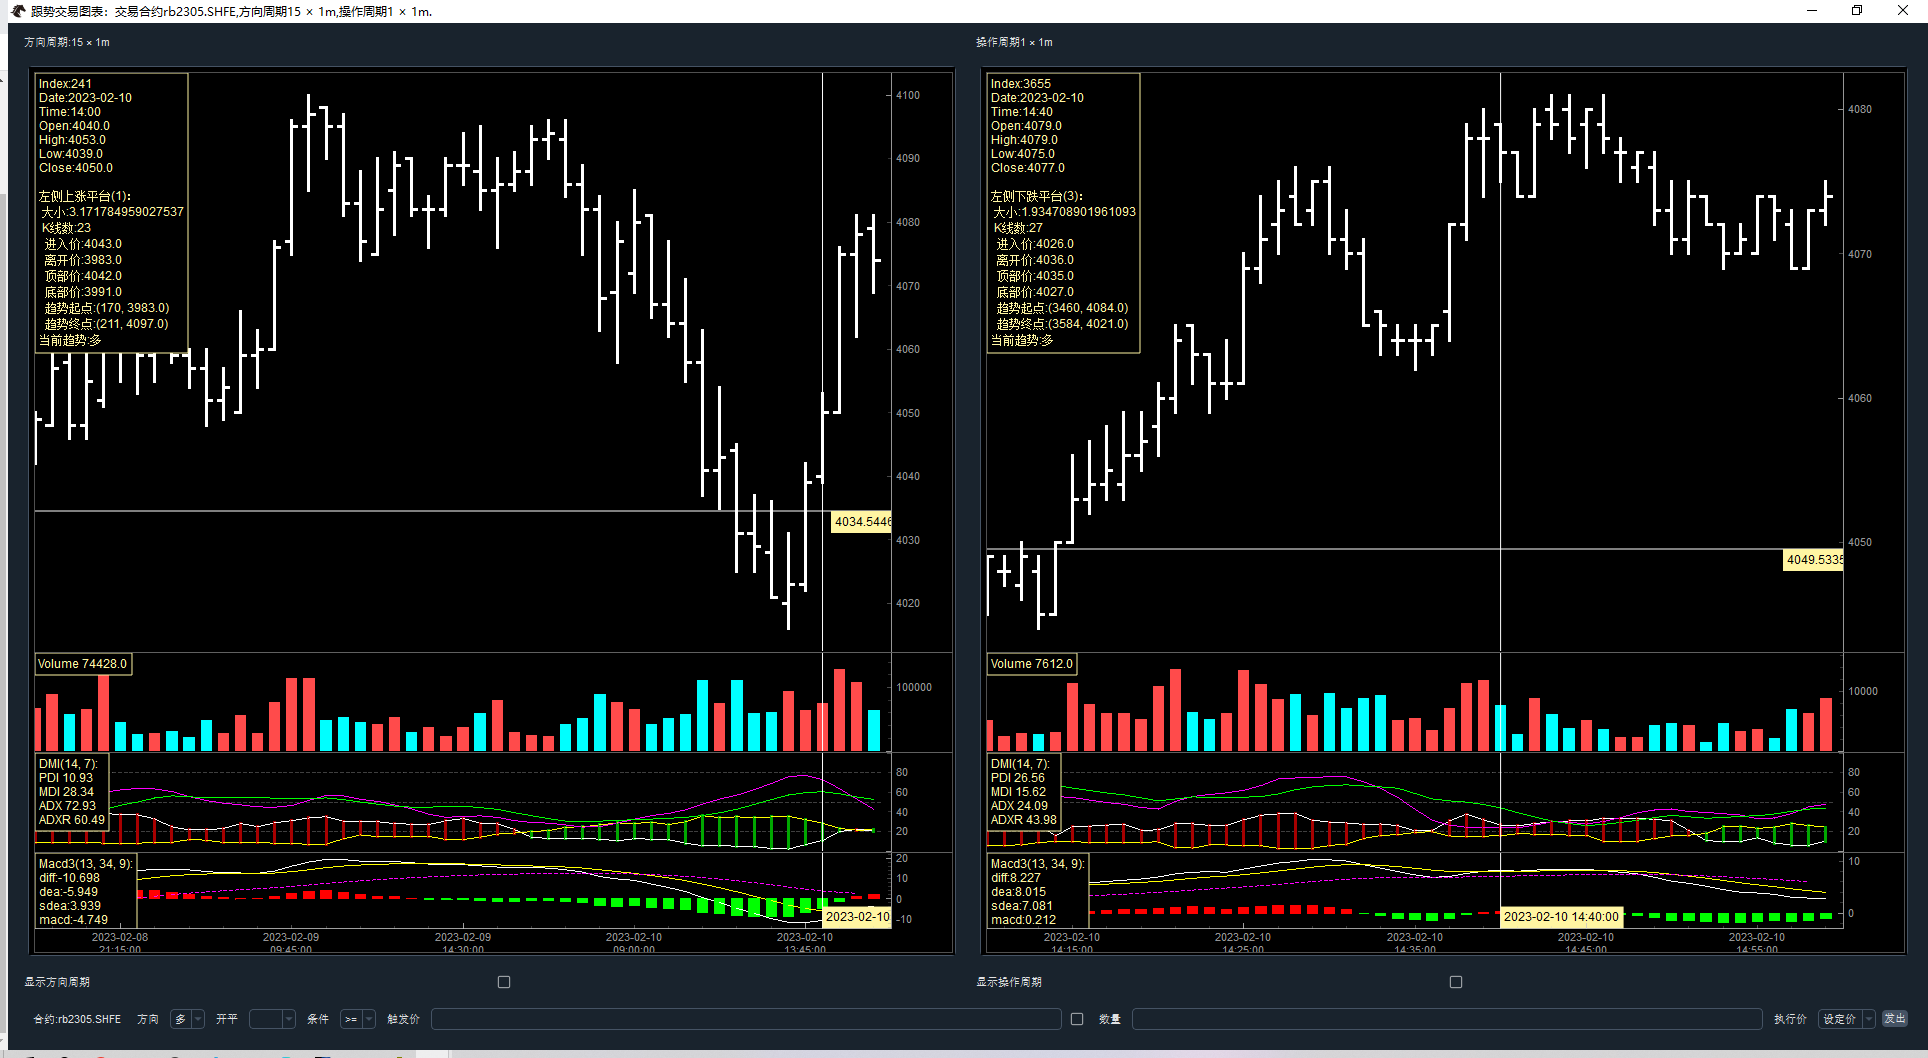
3.2 隐藏信息板图表

3.3 注意事项
- 使用中使用CTRL键+鼠标左键单击实现信息板的隐藏与显示;
- 可以单独隐藏与显示单个主图/副图的信息板,不会相互影响。
