import pandas as pd
import matplotlib.pyplot as plt
import mpl_finance as mpf
import tushare as ts
dataframe = ts.get_hist_data('510050','2019-06-01','2019-12-23')
fig, ax = plt.subplots(figsize=(6,4))
fig.subplots_adjust(bottom=0.2)
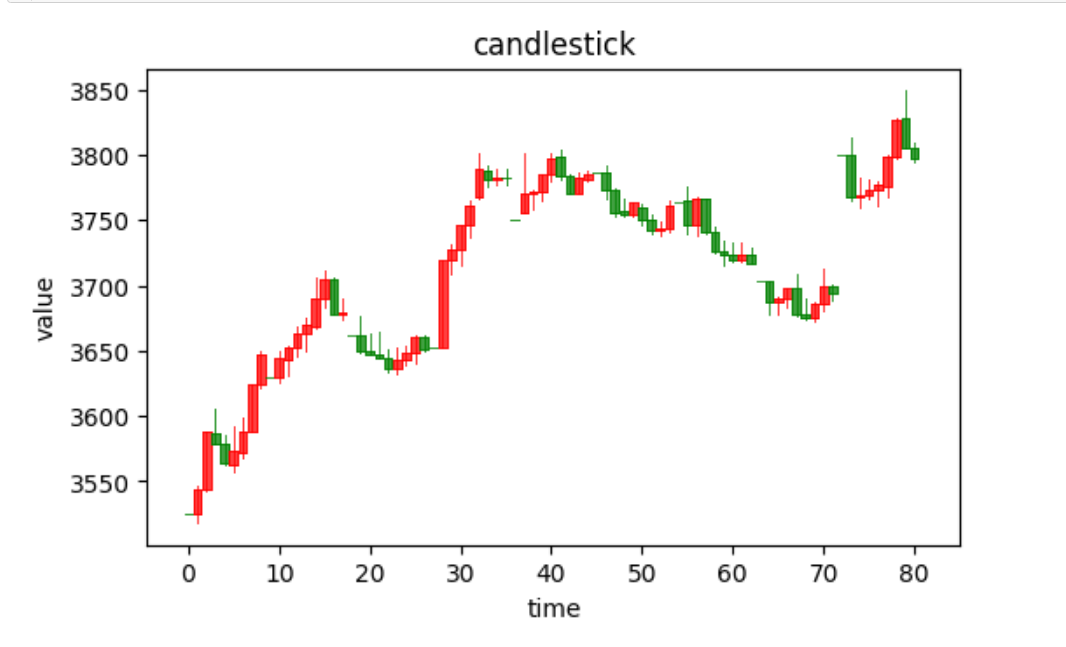
mpf.candlestick2_ohlc(ax,dataframe['open'], dataframe['high'],
dataframe['low'],dataframe['close'], width=0.9,
colorup='r',colordown='g')
ax.autoscale_view()
fig = plt.gcf()